Key points
- UK-owned monetary financial institutions and their branches and subsidiaries worldwide reported a decrease in consolidated external claims on an ultimate risk basis of $78.9 billion during 2022 Q3, to a level of $4,032.1 billion.
- By sector, the largest decrease was on the public sector, down by $77.1 billion to a level of $1,254.4 billion.
- By region, the largest decrease in claims was on Developed Countries, down $50.9 billion to a level of $2,384.7 billion.
Table A: Regional breakdown of external claims of UK-owned monetary financial institutions – End-Q3 2022
US$ billions
Not seasonally adjusted
| External claims on: | ||||||||||||
|---|---|---|---|---|---|---|---|---|---|---|---|---|
| Developed Countries | Offshore Centres | Developing countries: | Total | |||||||||
| Europe | Latin America & Caribbean | Africa & Middle East | Asia & Pacific | |||||||||
| Immediate Borrower | 2,362.5 | 812.0 | 26.5 | 76.9 | 163.1 | 538.7 | 4,039.3 | |||||
| Net Risk Transfers | 22.2 | -41.4 | -0.7 | -1.8 | -8.4 | 22.1 | -7.2 | |||||
| Ultimate Risk | 2,384.7 | 770.6 | 25.8 | 75.1 | 154.7 | 560.8 | 4,032.1 |
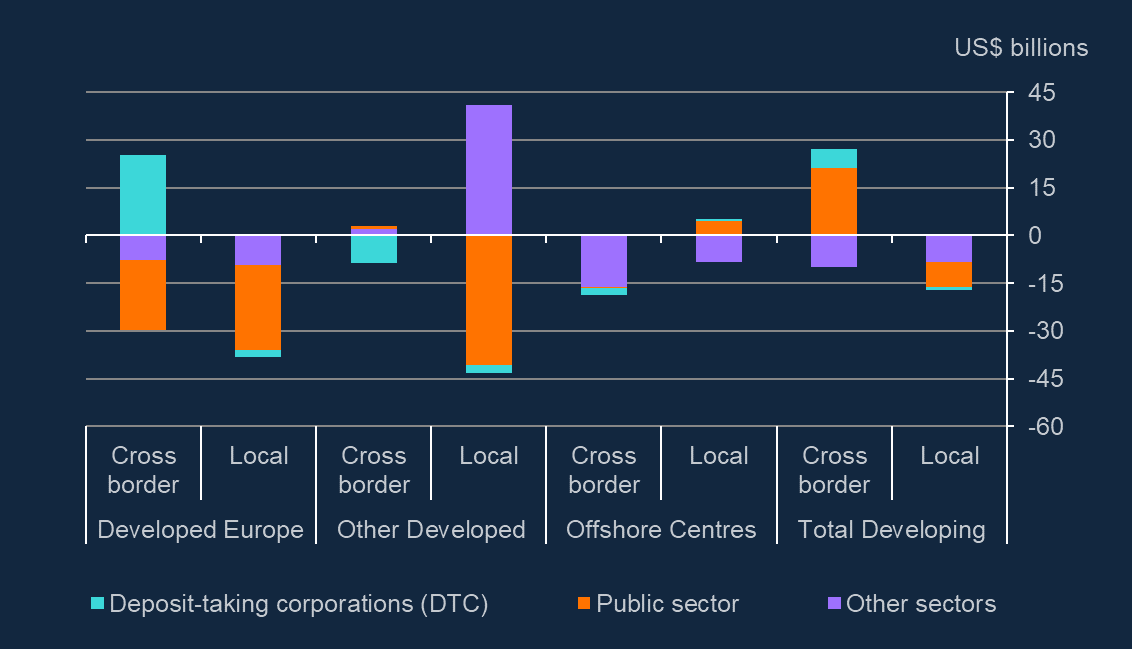
Chart 1: Changes in external claims on an ultimate risk basis by region and origin of claim

Chart 2: External claims on an ultimate risk basis analysed by country share

Consolidated external claims: Developed Countries
Changes in consolidated external claims on an ultimate risk basis on Developed Countries, by counterpart sector and by debtor country – Q3 2022
US$ billions
Not seasonally adjusted
Chart 3: Changes in consolidated claims by counterpart sector

Chart 4: Changes in consolidated claims by country (5 largest increases/decreases)

Table B: Changes in external claims on an ultimate risk basis: Developed Countries (US$ billions) – Q3 2022
| Total | of which by origin: | of which by sector: | ||||||||||||||
|---|---|---|---|---|---|---|---|---|---|---|---|---|---|---|---|---|
| Cross-border | Local | DTC | Public sector | OFC | NFC | HH | ||||||||||
| Largest increases | Japan | 3.4 | 7.2 | -3.8 | -2.2 | 4.9 | 1.4 | -0.6 | -0.1 | |||||||
| Spain | 1.6 | 1.7 | -0.1 | 3.1 | -0.7 | -0.4 | -0.4 | 0.0 | ||||||||
| New Zealand | 1.5 | 0.8 | 0.8 | 0.1 | 1.6 | 0.0 | 0.0 | -0.1 | ||||||||
| Norway | 1.3 | 1.3 | 0.0 | -0.2 | 0.3 | 1.1 | 0.1 | 0.0 | ||||||||
| Belgium | 1.2 | 1.4 | -0.1 | 2.1 | -1.0 | -0.1 | 0.2 | 0.0 | ||||||||
| Largest decreases | Switzerland | -13.3 | -12.1 | -1.2 | -1.8 | -12.1 | 0.1 | 0.7 | -0.2 | |||||||
| Ireland | -10.8 | -1.8 | -8.9 | -0.2 | -4.4 | -3.8 | 0.6 | -2.9 | ||||||||
| Canada | -8.2 | -4.3 | -3.9 | -3.9 | -5.2 | 3.9 | -1.8 | -1.2 | ||||||||
| France | -6.6 | 5.6 | -12.2 | 7.7 | -9.8 | -3.0 | 0.5 | -2.1 | ||||||||
| Germany | -6.3 | 0.9 | -7.2 | 8.6 | -9.4 | -4.0 | -1.3 | -0.2 |
Table C: Amounts outstanding of external claims on an ultimate risk basis: Developed Countries (US$ billions) – End-Q3 2022
| Total | of which by origin: | of which by sector: | ||||||||||||||
|---|---|---|---|---|---|---|---|---|---|---|---|---|---|---|---|---|
| Cross-border | Local | DTC | Public sector | OFC | NFC | HH | ||||||||||
| Largest increases | Japan | 210.9 | 91.0 | 119.9 | 49.5 | 70.2 | 81.2 | 9.6 | 0.3 | |||||||
| Spain | 19.3 | 18.8 | 0.4 | 14.5 | 0.0 | 0.8 | 3.8 | 0.2 | ||||||||
| New Zealand | 7.2 | 2.6 | 4.5 | 0.8 | 3.6 | 0.1 | 1.6 | 1.1 | ||||||||
| Norway | 9.1 | 9.1 | 0.0 | 1.4 | 3.6 | 3.0 | 1.0 | 0.0 | ||||||||
| Belgium | 9.3 | 8.5 | 0.8 | 3.9 | 2.3 | 0.7 | 2.4 | 0.1 | ||||||||
| Largest decreases | Switzerland | 29.0 | 17.8 | 11.1 | 7.3 | 6.6 | 2.2 | 8.1 | 4.7 | |||||||
| Ireland | 55.5 | 33.6 | 22.0 | 1.3 | 4.9 | 19.9 | 15.6 | 13.7 | ||||||||
| Canada | 133.7 | 51.9 | 81.8 | 23.7 | 30.4 | 22.3 | 29.6 | 27.8 | ||||||||
| France | 363.1 | 169.1 | 194.0 | 150.2 | 155.6 | 20.5 | 14.8 | 22.0 | ||||||||
| Germany | 195.9 | 87.8 | 108.1 | 63.8 | 118.8 | 3.5 | 4.9 | 4.9 |
Consolidated external claims: Offshore Centres
Changes in consolidated external claims on an ultimate risk basis on Offshore Centres, by counterpart sector and by debtor country – Q3 2022
US$ billions
Not seasonally adjusted
Chart 5: Changes in consolidated claims by counterpart sector

Chart 6: Changes in consolidated claims by country (5 largest increases/decreases)

Table D: Changes in external claims on an ultimate risk basis: Offshore Centres (US$ billions) – Q3 2022
| Total | of which by origin: | of which by sector: | ||||||||||||||
|---|---|---|---|---|---|---|---|---|---|---|---|---|---|---|---|---|
| Cross-border | Local | DTC | Public sector | OFC | NFC | HH | ||||||||||
| Largest increases | Mauritius | 0.9 | 1.1 | -0.2 | 0.5 | 0.1 | -0.4 | 0.7 | 0.0 | |||||||
| Guernsey | 0.3 | 0.2 | 0.0 | 0.0 | 0.0 | 0.5 | -0.2 | 0.0 | ||||||||
| Macao | 0.2 | 0.1 | 0.1 | 0.2 | 0.0 | 0.0 | 0.0 | 0.0 | ||||||||
| Panama | 0.1 | 0.1 | 0.0 | 0.2 | 0.1 | 0.0 | -0.1 | 0.0 | ||||||||
| No other increases greater than $0.1 bn | ||||||||||||||||
| Largest decreases | Cayman Islands | -13.3 | -13.5 | 0.2 | 0.0 | 0.0 | -12.5 | -0.7 | -0.2 | |||||||
| Singapore | -4.9 | -3.0 | -2.0 | -1.4 | -0.2 | 0.8 | -2.9 | -1.2 | ||||||||
| Jersey | -2.4 | -2.1 | -0.3 | 0.0 | 0.0 | -0.6 | -1.3 | -0.5 | ||||||||
| West Indies UK | -0.9 | -0.9 | 0.0 | 0.0 | 0.0 | -0.1 | -0.7 | -0.1 | ||||||||
| Hong Kong | -0.5 | 0.0 | -0.5 | -1.1 | 4.5 | 2.9 | -6.6 | -0.2 |
Table E: Amounts outstanding of external claims on an ultimate risk basis: Offshore Centres (US$ billions) – End-Q3 2022
| Total | of which by origin: | of which by sector: | ||||||||||||||
|---|---|---|---|---|---|---|---|---|---|---|---|---|---|---|---|---|
| Cross-border | Local | DTC | Public sector | OFC | NFC | HH | ||||||||||
| Largest increases | Mauritius | 5.7 | 4.2 | 1.4 | 1.7 | 0.4 | 0.4 | 3.0 | 0.2 | |||||||
| Guernsey | 12.2 | 7.8 | 4.5 | 0.2 | 0.1 | 6.1 | 3.3 | 2.5 | ||||||||
| Macao | 4.3 | 1.0 | 3.4 | 0.5 | 0.5 | 0.0 | 2.1 | 1.3 | ||||||||
| Panama | 1.5 | 1.5 | 0.0 | 0.4 | 0.2 | 0.0 | 0.7 | 0.2 | ||||||||
| No other increases greater than $0.1 bn | ||||||||||||||||
| Largest decreases | Cayman Islands | 28.8 | 28.5 | 0.3 | 0.4 | 0.0 | 24.2 | 3.1 | 1.1 | |||||||
| Singapore | 145.0 | 34.0 | 111.0 | 8.1 | 65.0 | 12.5 | 25.2 | 34.1 | ||||||||
| Jersey | 28.5 | 23.4 | 5.0 | 1.1 | 0.2 | 16.9 | 5.3 | 4.9 | ||||||||
| West Indies UK | 3.9 | 3.8 | 0.1 | 0.0 | 0.0 | 0.5 | 2.0 | 1.4 | ||||||||
| Hong Kong | 519.6 | 41.4 | 478.2 | 12.1 | 148.6 | 47.6 | 145.9 | 165.4 |
Consolidated external claims: Developing Countries
Changes in consolidated external claims on an ultimate risk basis on Developing Countries, by counterpart sector and by debtor country – Q3 2022
US$ billions
Not seasonally adjusted
Chart 7: Changes in consolidated claims by counterpart sector

Chart 8: Changes in consolidated claims by country (5 largest increases/decreases)

Table F: Changes in external claims on an ultimate risk basis: Developing Countries (US$ billions) – Q3 2022
| Total | of which by origin: | of which by sector: | ||||||||||||||
|---|---|---|---|---|---|---|---|---|---|---|---|---|---|---|---|---|
| Cross-border | Local | DTC | Public sector | OFC | NFC | HH | ||||||||||
| Largest increases | Brazil | 17.6 | 17.5 | 0.1 | 0.8 | 16.5 | 0.2 | 0.2 | 0.0 | |||||||
| Israel | 3.6 | 3.1 | 0.5 | 0.6 | 3.4 | -0.2 | -0.1 | 0.0 | ||||||||
| Czech Republic | 2.5 | 2.5 | -0.1 | 0.0 | 2.5 | 0.0 | 0.0 | 0.0 | ||||||||
| Philippines | 1.1 | 1.0 | 0.1 | 0.7 | 0.0 | 0.2 | 0.2 | 0.0 | ||||||||
| Mexico | 0.8 | -0.3 | 1.1 | -1.5 | 2.2 | -0.6 | 0.3 | 0.4 | ||||||||
| Largest decreases | South Korea | -7.3 | -1.2 | -6.1 | 0.8 | -3.4 | -0.5 | -0.8 | -3.4 | |||||||
| China | -5.7 | 0.2 | -5.9 | 1.0 | -0.3 | -0.2 | -4.8 | -1.4 | ||||||||
| United Arab Emirates | -3.4 | -1.4 | -2.1 | 0.1 | -2.3 | 0.2 | -1.3 | -0.2 | ||||||||
| Taiwan | -2.4 | -0.8 | -1.6 | 2.4 | -1.3 | -0.6 | -2.2 | -0.7 | ||||||||
| Thailand | -1.5 | -0.3 | -1.1 | -0.6 | -0.7 | 0.0 | -0.2 | 0.1 |
Table G: Amounts outstanding of external claims on an ultimate risk basis: Developing Countries (US$ billions) – End-Q3 2022
| Total | of which by origin: | of which by sector: | ||||||||||||||
|---|---|---|---|---|---|---|---|---|---|---|---|---|---|---|---|---|
| Cross-border | Local | DTC | Public sector | OFC | NFC | HH | ||||||||||
| Largest increases | Brazil | 28.2 | 26.6 | 1.6 | 4.8 | 19.6 | 1.2 | 2.5 | 0.1 | |||||||
| Israel | 9.8 | 7.7 | 2.1 | 1.5 | 7.4 | 0.1 | 0.4 | 0.3 | ||||||||
| Czech Republic | 12.3 | 10.8 | 1.5 | 0.1 | 11.8 | 0.0 | 0.4 | 0.0 | ||||||||
| Philippines | 6.7 | 4.0 | 2.8 | 2.8 | 1.3 | 0.3 | 1.7 | 0.7 | ||||||||
| Mexico | 34.8 | 2.8 | 32.0 | 0.9 | 11.0 | 1.4 | 11.2 | 10.3 | ||||||||
| Largest decreases | South Korea | 89.0 | 23.8 | 65.1 | 15.2 | 25.5 | 5.0 | 16.6 | 26.7 | |||||||
| China | 233.1 | 111.3 | 121.8 | 42.0 | 68.2 | 23.1 | 80.9 | 18.9 | ||||||||
| United Arab Emirates | 50.3 | 17.6 | 32.7 | 11.3 | 10.6 | 1.3 | 18.7 | 8.5 | ||||||||
| Taiwan | 55.7 | 19.5 | 36.2 | 13.1 | 15.3 | 4.6 | 8.9 | 13.8 | ||||||||
| Thailand | 10.8 | 2.5 | 8.3 | 3.4 | 2.9 | 0.5 | 3.6 | 0.4 |